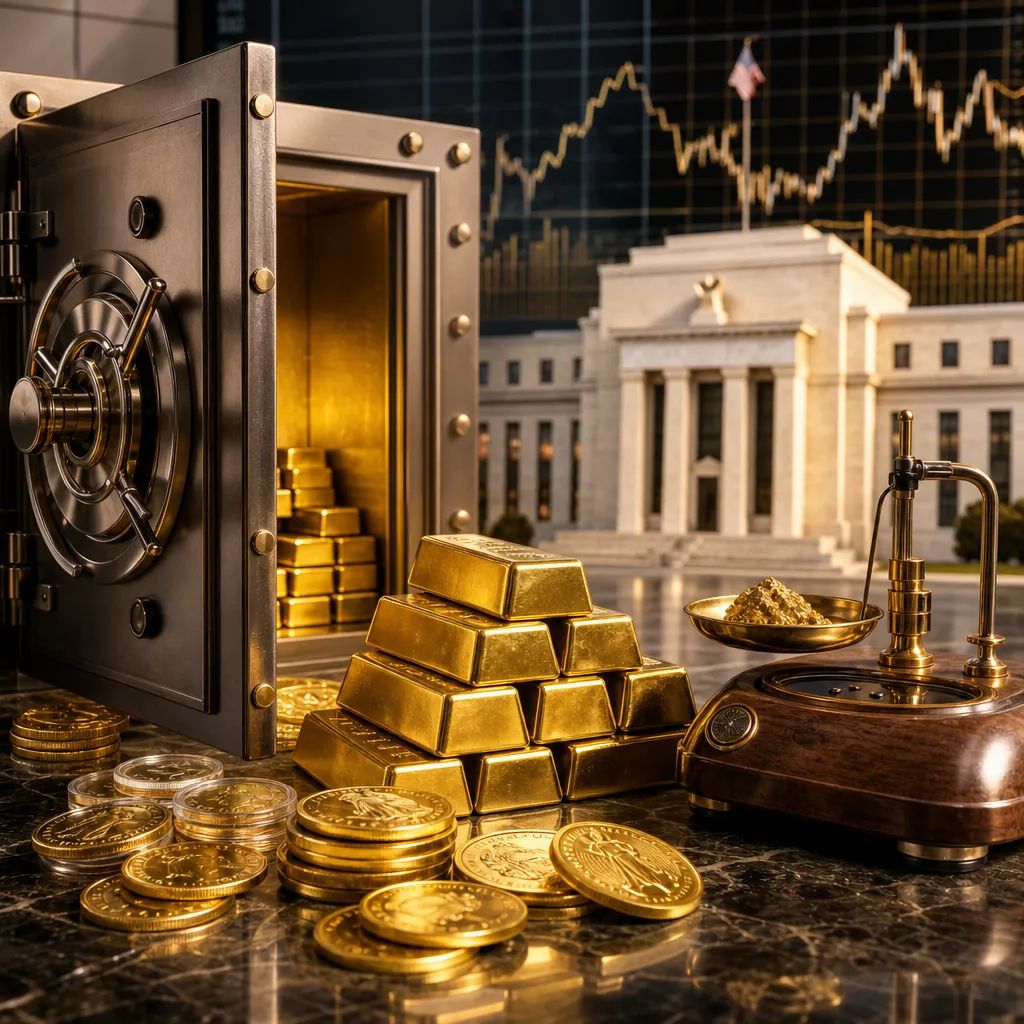
Gold price forecast indicators are the signals analysts and investors watch to judge whether gold is more likely to strengthen, stall, or weaken. The most important point is that no single indicator “predicts” gold on its own. Gold is influenced by macroeconomics, currencies, financial stress, central bank behavior, and market positioning, so useful forecasts come from reading a group of indicators together rather than chasing one headline number.
If you are trying to understand where gold may go next, start with the variables that most directly affect opportunity cost, safe-haven demand, and the value of the US dollar. In practice, that means watching real yields, Federal Reserve expectations, inflation trends, the dollar, ETF flows, central bank buying, and risk sentiment. The sections below explain how these indicators work, when they matter most, and where they can mislead.
What gold price forecast indicators actually tell you
A gold price forecast indicator is not a guaranteed trading signal. It is a variable that tends to influence gold through a clear economic mechanism. Some indicators are leading, some are coincident, and some only matter when markets are stressed.
The table below summarizes the core indicators most professionals monitor first.
| Indicator | Typical Influence on Gold | Why It Matters |
|---|---|---|
| Real yields | Falling real yields often support gold | Lower inflation-adjusted bond returns reduce the opportunity cost of holding a non-yielding asset |
| US dollar | A weaker dollar often supports gold | Gold is globally priced in dollars, so dollar weakness can make gold cheaper in other currencies and lift demand |
| Federal Reserve policy expectations | Dovish expectations often support gold | Markets price future rates, liquidity conditions, and recession risk before central bank decisions fully arrive |
| Inflation expectations | Can support gold, especially if policy lags behind inflation | Gold may benefit when investors seek protection against currency debasement or negative real rates |
| Central bank demand | Usually supportive over the medium to long term | Official-sector buying can strengthen structural demand and signal reserve diversification away from some fiat exposures |
| Gold ETF flows | Inflows often support price momentum | ETF demand reflects investor appetite for liquid gold exposure and can amplify market trends |
| Geopolitical or financial stress | Often supportive, but not always immediately | Gold can attract safe-haven flows, although early crisis phases may trigger forced selling for liquidity |
The main takeaway is that gold forecasts are strongest when several of these indicators point in the same direction. A bullish gold view is more credible when, for example, real yields are falling, the dollar is softening, and safe-haven demand is rising at the same time.
The single most important indicator: real yields
For many market professionals, real yields are the most useful starting point for a gold price forecast. A real yield is the return on a bond after adjusting for inflation expectations. Gold does not pay income, so when real returns on bonds rise, holding gold often becomes less attractive. When real yields fall, the relative appeal of gold often improves.
This relationship is strong because it captures both interest rates and inflation in one framework. A rise in nominal yields does not automatically hurt gold if inflation expectations are rising even faster. Likewise, stable inflation with sharply higher nominal rates can pressure gold if real yields move up.
What to watch in practice:
- The direction of inflation-adjusted Treasury yields rather than nominal yields alone
- Whether rate hikes are outpacing inflation or lagging behind it
- Whether bond markets are pricing future easing because growth is slowing
The limitation is important: gold can still rise during periods of higher real yields if geopolitical stress, central bank buying, or a sharp equity market selloff dominates the usual macro relationship.
Why the US dollar matters so much
Gold is usually quoted internationally in US dollars, so the dollar is one of the most practical gold price forecast indicators. When the dollar strengthens, gold often faces headwinds because it becomes more expensive in non-dollar currencies. When the dollar weakens, gold often gets support from broader global demand.
But this is not just a mechanical currency conversion story. The dollar also reflects global liquidity, relative US growth, monetary policy expectations, and risk appetite. A rising dollar during a crisis can offset part of gold’s safe-haven appeal, at least temporarily.
The most useful question is not simply “Is the dollar up or down?” but “Why is the dollar moving?” A stronger dollar driven by aggressive real-rate tightening is usually more negative for gold than a stronger dollar driven by short-term risk aversion alone.
Inflation is important, but the relationship is not automatic
Many investors assume higher inflation always means higher gold prices. That is too simplistic. Gold often responds less to current inflation and more to the market’s expectations about how central banks will respond to inflation.
If inflation rises while policy remains loose and real rates stay low or negative, gold may benefit. But if inflation rises and central banks respond with aggressive tightening that lifts real yields and strengthens the dollar, gold may struggle.
This is a better way to think about it:
| Economic Condition | Typical Pressure on Gold | Mechanism | Important Exception |
|---|---|---|---|
| Inflation rising, real yields falling | Often positive | Inflation outpaces bond returns, improving gold’s relative appeal | If growth is strong and equities attract most capital, gold may lag |
| Inflation rising, Fed tightening aggressively | Often mixed or negative | Higher policy rates can lift real yields and support the dollar | If markets fear policy error or recession, gold can still rise |
| Inflation falling, rates still high | Often negative | Disinflation can keep real yields elevated | If financial stress emerges, safe-haven demand can offset this |
| Stagflation risk | Often positive | Weak growth plus persistent inflation can favor defensive assets | Short-term liquidity selling can still create drawdowns |
The practical lesson is that inflation matters most through real yields, policy credibility, and economic stress—not as an isolated headline figure.
Federal Reserve expectations matter more than rate decisions alone
Gold usually reacts to what markets think the Federal Reserve will do next, not just to the latest official decision. Futures markets and bond markets continuously reprice expected policy paths. That means gold may rally before the Fed cuts rates if investors believe cuts are coming because growth is cooling or financial conditions are tightening.
This makes forward-looking indicators especially useful:
- Changes in Treasury yields across the curve
- Rate-cut or rate-hike expectations implied by markets
- Shifts in Fed communication from hawkish to neutral or dovish
- Signs that inflation data is softening enough to change the policy outlook
Gold often performs best when the market moves from “higher for longer” toward “policy easing ahead,” especially if recession concerns are simultaneously increasing.
ETF flows, futures positioning, and market sentiment
Macro drivers tell you why gold should move. Flow indicators help show whether investors are actually acting on that view. Gold ETF inflows can indicate rising institutional and retail demand for liquid gold exposure, while futures positioning can reveal whether the market is already crowded.
If gold is rising while ETF inflows are strengthening, the move may have broader participation behind it. If gold is falling despite supportive macro data, heavy redemptions or long-position liquidations may be part of the explanation.
Positioning can also warn of vulnerability. If speculative long positions become very extended, gold may be more exposed to pullbacks even when the medium-term fundamentals still look constructive.
Useful sentiment clues include:
- Persistent ETF inflows or outflows
- Large speculative positioning imbalances in futures markets
- Whether gold rallies on bad news and holds gains afterward
- Whether dips are bought quickly or sold aggressively
Central bank demand and structural support
Central bank buying is a major medium-term indicator because it reflects official reserve management rather than short-term retail enthusiasm. Central banks may buy gold to diversify reserves, reduce concentration in foreign currencies, and strengthen confidence in their balance sheets.
This type of demand does not always move the gold price immediately, but it can create a durable floor under the market over time, particularly when private investment demand is uneven.
Central bank demand is most informative when combined with broader macro signals. Strong official buying alongside falling real yields and a weaker dollar is more supportive than central bank buying alone.
Scenario analysis is better than precise price prediction
The most reliable way to use gold price forecast indicators is to build scenarios. Exact price targets often create false confidence, especially when the market is being driven by fast-changing policy expectations or geopolitical shocks.
A scenario framework is more practical.
| Scenario | Conditions | Potential Implication for Gold |
|---|---|---|
| Bullish | Real yields decline, Fed turns dovish, dollar weakens, ETF inflows improve, geopolitical or recession risk rises | Gold could remain well supported and potentially extend higher |
| Base case | Inflation gradually cools, policy expectations stabilize, dollar ranges, central bank demand stays supportive | Gold could trade in a broad range with an upward bias depending on investment flows |
| Bearish | Real yields rise, dollar strengthens, growth remains resilient, inflation softens, safe-haven demand fades | Gold could face pressure or consolidate lower |
The value of this approach is that it forces you to identify what would need to change for your gold view to be wrong.
How to build a practical gold forecasting checklist
If you want a usable process, do not try to monitor everything equally. Start with a short checklist and update it regularly.
- Check real yields: Are they rising or falling?
- Check the dollar: Is it strengthening broadly, and why?
- Review Fed expectations: Is the market pricing tighter or easier policy ahead?
- Assess inflation context: Is inflation easing, persistent, or reaccelerating?
- Watch flows: Are ETFs and futures positioning confirming the move?
- Consider risk sentiment: Is gold behaving as a safe haven or being sold for liquidity?
- Look at structural demand: Is central bank buying providing background support?
This checklist helps separate long-term drivers from short-term noise. It also reduces the common mistake of treating one economic release as decisive when the broader trend still points the other way.
Limits of gold price forecast indicators
Gold forecasting is probabilistic, not mechanical. Relationships that work well over one period can weaken or reverse in another. For example, gold and the dollar often move inversely, but both can rise together during periods of global stress.
Short-term price action can also be driven by factors that are hard to model cleanly, including options hedging, liquidation pressure, month-end flows, and positioning squeezes. Physical demand and bullion coin premiums may tell a different story from futures-market momentum.
The key risks when using forecast indicators are:
- Overreliance on one indicator
- Ignoring the difference between nominal and real rates
- Confusing correlation with causation
- Using long-term indicators to trade short-term swings
- Forgetting that markets price expectations before official data confirms them
The best forecasts stay conditional: if these variables continue, gold may hold up; if they reverse, the outlook changes.
FAQ
What is the best indicator for forecasting gold prices?
There is no perfect single indicator, but real yields are often the most informative starting point. They capture the inflation-adjusted return investors can earn in bonds, which directly affects gold’s opportunity cost.
Do interest rates always move gold in the opposite direction?
No. What matters more is the interaction between interest rates, inflation expectations, and the dollar. Gold can rise even when nominal rates are high if real yields are falling or recession and geopolitical risks are increasing.
Why does a weaker US dollar often help gold?
Because gold is commonly priced in dollars, a weaker dollar can make gold more affordable for non-US buyers and can reflect looser financial conditions. That combination often supports demand.
Does inflation guarantee higher gold prices?
No. Inflation can support gold, but only under certain conditions. If central banks respond with aggressive tightening that raises real yields, inflation by itself may not be enough to push gold higher.
How important are gold ETF flows?
They are important because they show whether investors are adding or reducing liquid gold exposure. ETF inflows can confirm a bullish macro story, while persistent outflows can weaken it.
Can central bank gold buying drive the market on its own?
It can provide meaningful structural support, especially over the medium term, but it is usually not the only driver. Gold still responds strongly to real yields, the dollar, and broader risk sentiment.
Are gold price forecasts reliable over short time frames?
Short-term forecasts are much less reliable than medium-term scenario analysis. Daily and weekly moves can be dominated by positioning, volatility, and unexpected headlines rather than stable macro trends.
What should investors watch first each week?
A practical sequence is: real yields, the dollar, Fed expectations, inflation data, ETF flows, and any major geopolitical or financial stress signals. That gives a balanced view of both macro and market behavior.
Sources
- World Gold Council – gold market research and Gold Demand Trends
- Federal Reserve Economic Data (FRED) – interest rate, yield, and macroeconomic data
- LBMA – gold market and benchmark information