The relationship between gold price trajectories and investor sentiment offers a compelling window into broader economic dynamics. From sudden spikes during financial crises to gradual ascents amid currency devaluation, patterns in the price of this precious metal can reveal the collective mindset of global market participants. By examining historical data, technical indicators, and regional influences, we gain insights into how shifts in investor confidence shape—and are shaped by—the ebb and flow of the gold market.
Historical Price Movements and Global Events
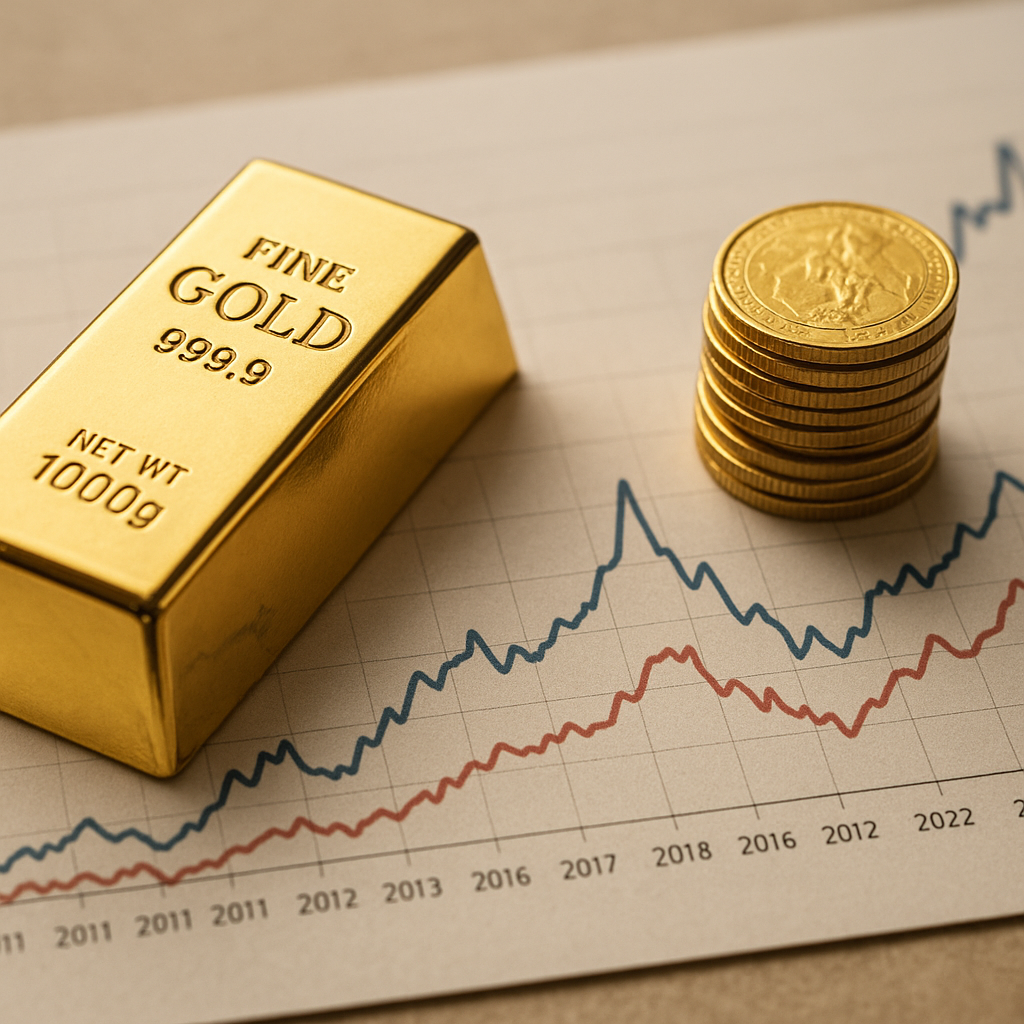
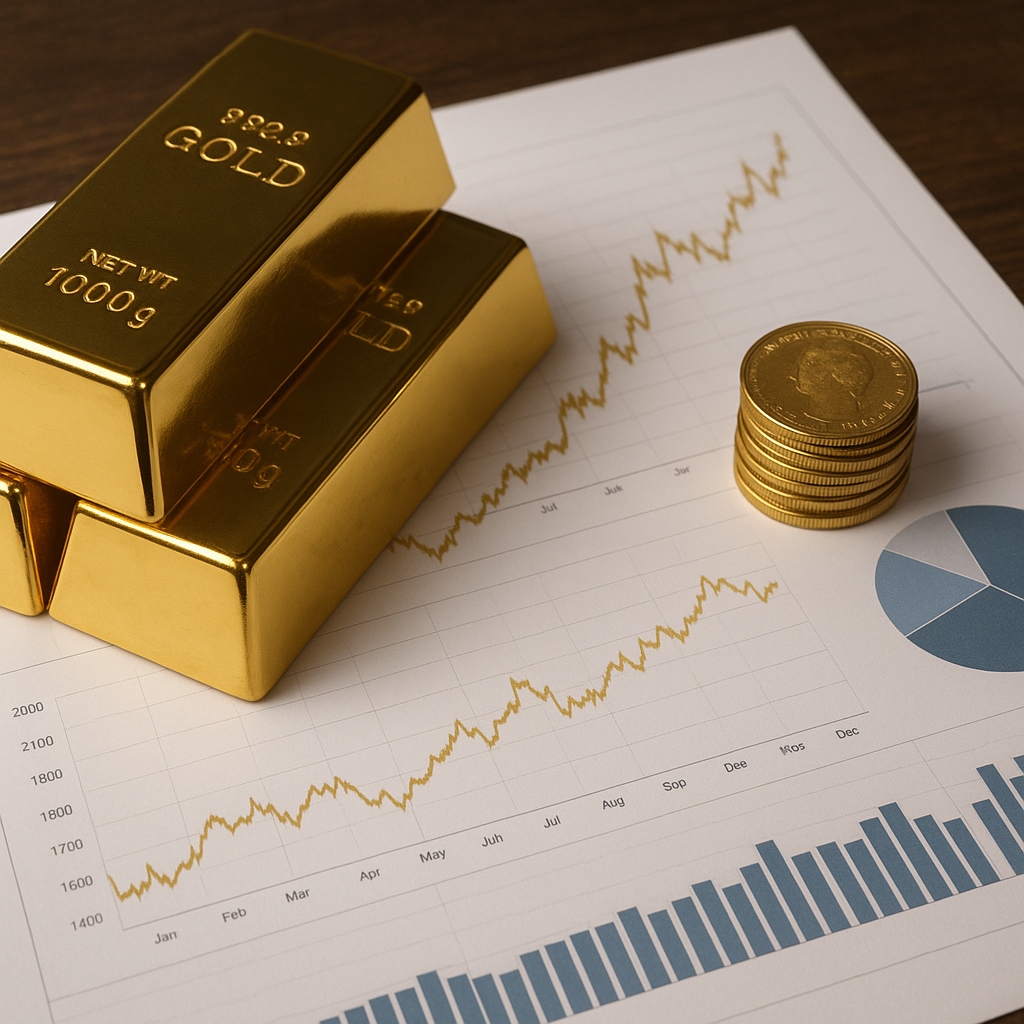
Over the past century, the value of gold has oscillated in response to seismic geopolitical and economic events. In the early 1970s, the end of the Bretton Woods system liberated gold from a fixed price benchmark, unleashing an era of greater volatility. During stagflation in the late 1970s and early 1980s, gold surged above $800 per ounce as investors sought a shield against skyrocketing inflation. Similarly, the 2008 financial crisis sparked a dramatic rally, pushing prices above $1,000, fueled by fears of systemic banking failures.
- 1971–1980: Post–Bretton Woods adjustment and inflationary spiral
- 2001–2011: Steady climb amid dot-com crash and housing meltdown
- 2020–2022: Pandemic-driven stimulus and currency debasement concerns
These episodes underscore gold’s role as a safe haven asset. When confidence in equities or fiat currencies wanes, demand for gold typically accelerates, driving prices upward. Conversely, in bull markets for stocks—with rising interest rates—gold may underperform as capital flows chase higher-yielding assets.
Market Psychology and Investor Behavior
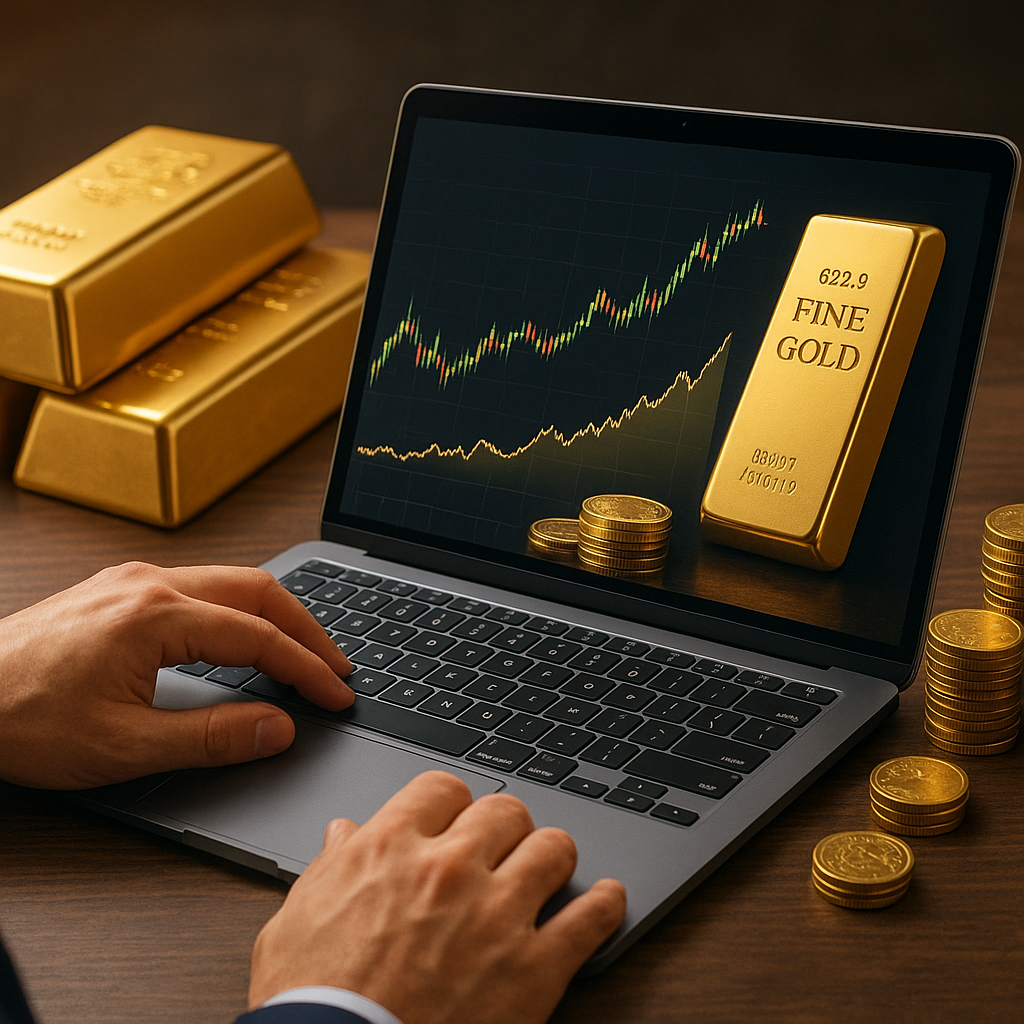
Boolean patterns in price charts often mirror collective emotions. Fear, greed, and uncertainty can be mapped to recognizable technical formations. For instance, a sharp breakout above a key resistance line often signifies a wave of panic–driven buying, whereas a protracted sideways channel may indicate market indecision.
Sentiment Indicators
Key metrics such as the Commitment of Traders report and gold-related exchange-traded funds inflows help quantify prevailing sentiment. When large speculators accumulate unprecedented net-long positions, this can signal over-optimism and potential pullback. Conversely, elevated hedge fund short interest often precedes a short-squeeze rally.
- Volatility Index comparisons: risk-on vs. risk-off cycles
- Fund flows: ETF purchases as proxy for retail and institutional demand
- Open interest: shifts in futures positions revealing tactical positioning
By tracking these market signals, analysts can anticipate turning points. For example, a divergence between rising gold prices and declining open interest may hint at weakening momentum, foreshadowing a reversal.
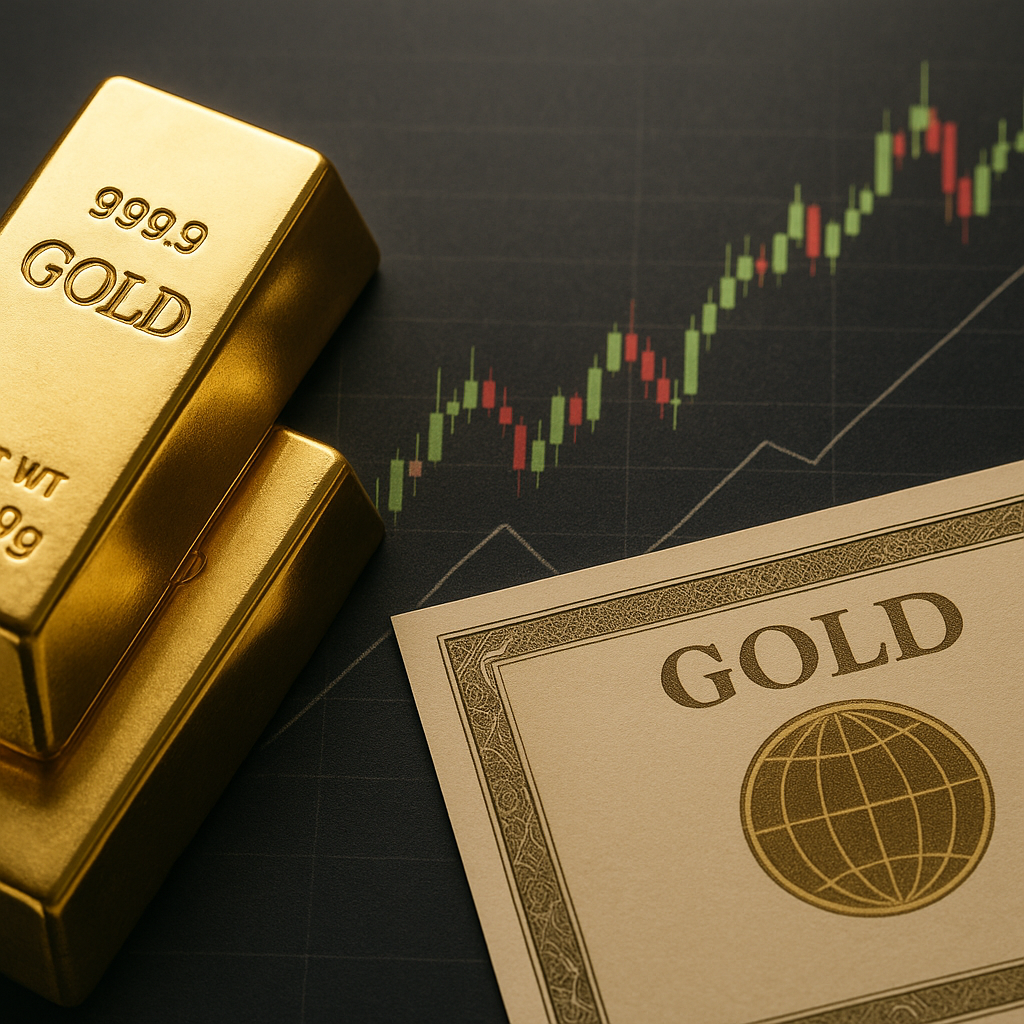
Technical Patterns and Predictive Analysis
Technical analysts scrutinize classic chart patterns—triangles, head-and-shoulders, flags—to forecast next moves. During prolonged uptrends, ascending triangles often precede strong breakouts, while descending wedges within downtrends can mark exhaustion points before recovery.
- Breakout patterns: Confirmed by volume spikes and retests of breakout levels
- Moving average crossovers: 50-day vs. 200-day crossover as trend-confirmation tool
- Relative Strength Index (RSI): Overbought/oversold thresholds signaling potential pullbacks
For example, in mid-2020, gold formed an ascending channel on the daily chart, with successive higher highs and higher lows. A breakout above the upper trendline, coupled with RSI breaking above 70, marked a powerful momentum surge toward record highs near $2,075. Traders who recognized this pattern captured outsized gains by aligning with broader market sentiment.
Diverse Regional Influences on Gold Movements
Though gold trades globally, regional demand and policy decisions can produce localized price dynamics. In Asia, particularly India and China, festival seasons and wedding seasons drive physical demand spikes. Central banks, notably in emerging markets, have ramped up foreign reserve accumulation, with purchases reaching multi-decade highs.
- Emerging market reserves: Turkey, Russia, and Kazakhstan expanding gold holdings
- Jewelry demand: Seasonal peaks in South Asia influencing spot premiums
- Regulatory shifts: Changes in import duties and capital controls affecting local price spreads
Meanwhile, Western central banks maintain substantial gold reserves as part of their role in safeguarding the reserve currency status of the dollar. When central banks signal dovish monetary policy—even in the absence of high inflation—gold often benefits from lower real yields.
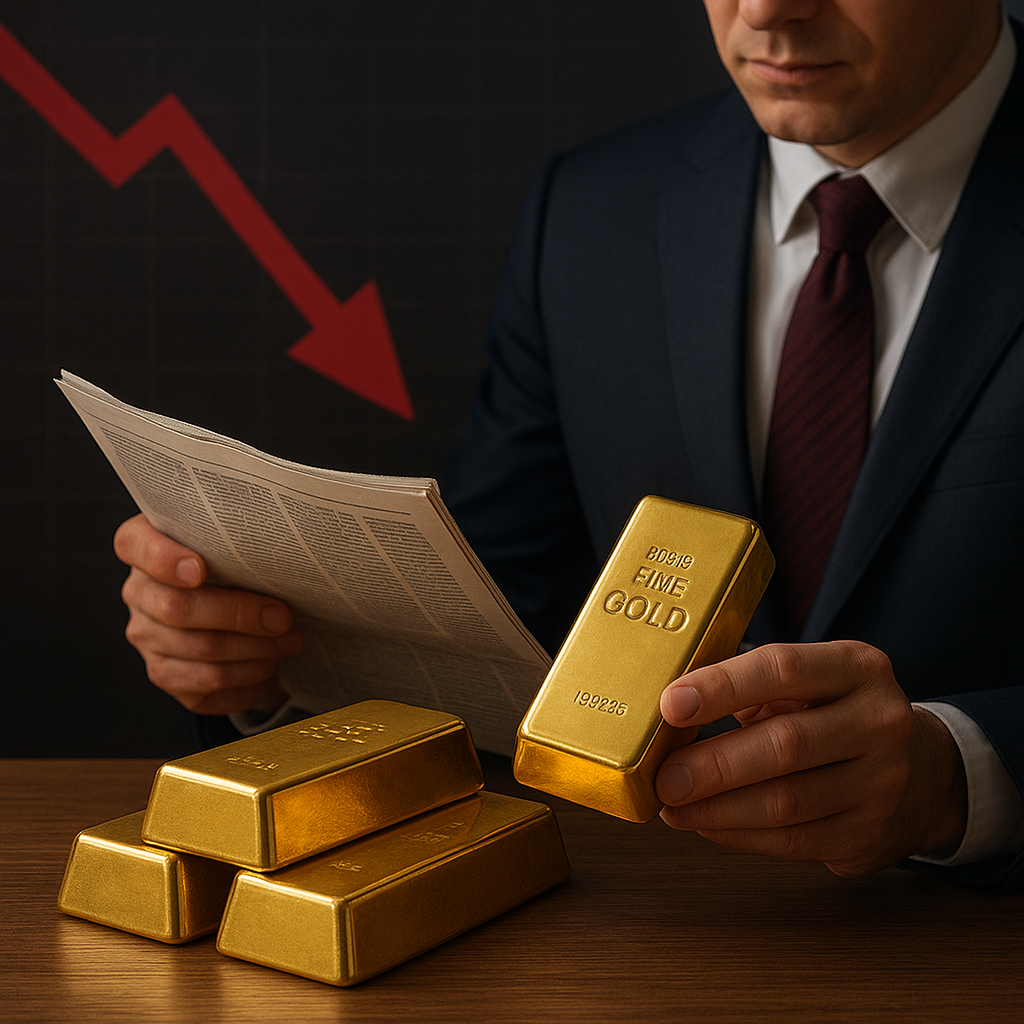
Geopolitical Risks and Strategic Allocation
Periods of heightened geopolitical tension often result in rapid gold accumulation, as investors hedge against currency debasement or supply chain disruptions. The invasion of Ukraine in 2022, for instance, triggered a temporary flight to safety, sending gold above $2,000. This reflects gold’s enduring appeal as an insurance policy in portfolios.
Strategic asset allocators consider gold’s low correlation with equities and bonds. A modest allocation—ranging from 5% to 15%—can reduce overall portfolio risk while preserving upside in diversification scenarios. The positioning of gold within multi-asset portfolios thus becomes a barometer of risk appetite and expectations of future volatility.
Conclusion: Integrating Patterns Into Portfolio Strategy
Analyzing gold price patterns offers more than historical curiosity; it equips investors with actionable intelligence on collective psychology and macroeconomic forecasts. By weaving together technical formations, sentiment metrics, and regional demand drivers, market participants can refine entry and exit strategies. Ultimately, the trajectory of gold embodies a narrative of global confidence—or the lack thereof—in fiat systems and economic stability.