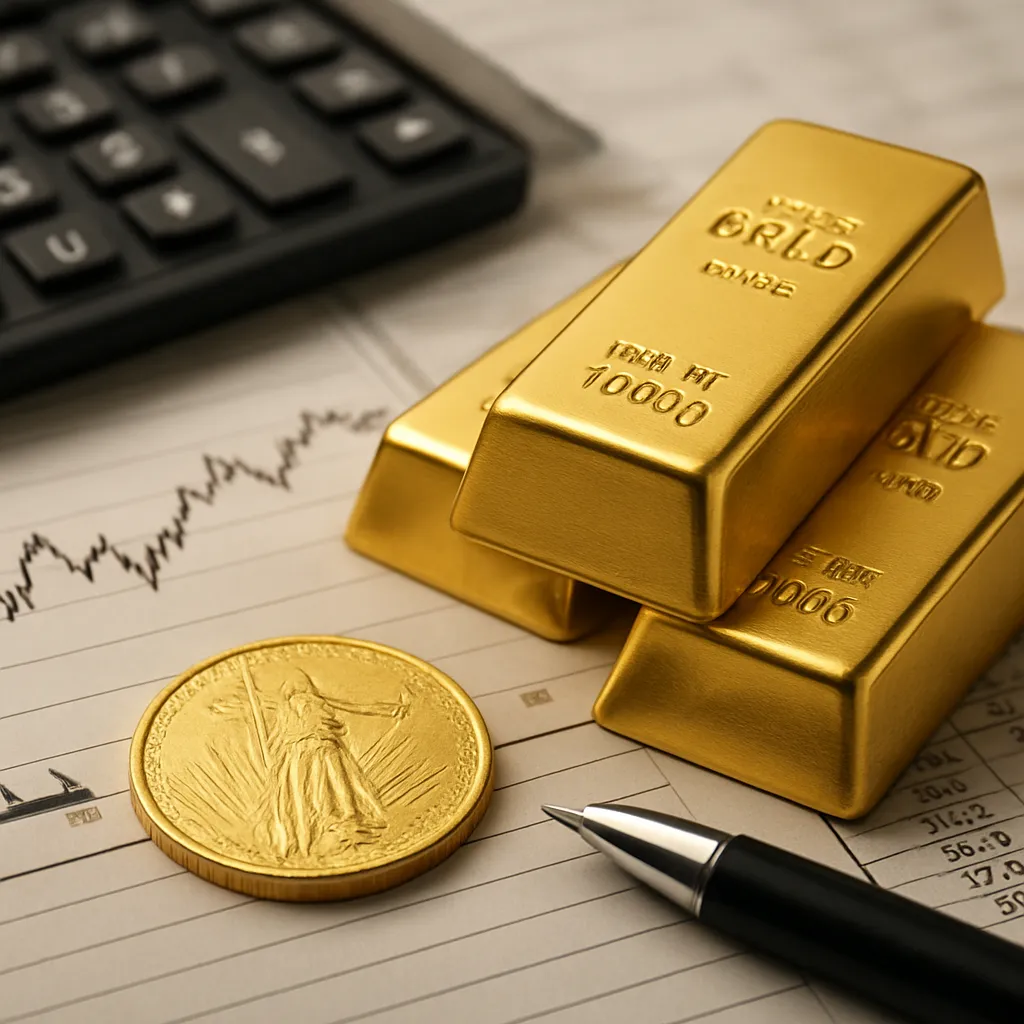
Investors have long observed that the price of gold does not move at random. Over decades of market observations, patterns emerge that can guide strategic bullion purchases. Understanding these cycles involves recognizing both the predictable and the less obvious forces at play. By analyzing historical data and factoring in seasonal fluctuations, one can identify windows of opportunity for acquiring gold at comparatively lower prices. This article delves into key seasonal trends, offers a detailed review of past movements, examines external catalysts, and outlines practical tactics to time purchases effectively.
Seasonal Trends in Precious Metals Pricing
Seasonal influences on metal markets are shaped by cultural, industrial, and macroeconomic factors. Each quarter brings its own demand pressures and supply dynamics, driving fluctuations in the demand for physical bullion. Recognizing these cycles can help investors anticipate more desirable entry points.
- First Quarter Slowdown: After holiday spending and year-end rebalancing, this period often shows subdued activity. Western demand tapers off, while Eastern markets prepare for spring festivals.
- Spring Rally: In South Asia, weddings and festivals like Akshaya Tritiya and Diwali preparations elevate appetite for Jewellery. This rise typically begins in late March and peaks by May.
- Summer Consolidation: The Northern Hemisphere’s summer can lead to reduced trading volume. Higher yields on short-term debt instruments sometimes pull speculative capital away from precious metals.
- Autumn Surge: As central banks finalize policy reviews and investors reposition ahead of year-end, October and November often witness renewed momentum in investment buying.
- Year-End Adjustment: December may see profit-taking after a rally, or additional purchases as a hedge against fiscal uncertainties in the upcoming calendar year.
Seasonal seasonality alone does not guarantee a bargain, but it provides a structural framework. By monitoring traditional demand zones and global liquidity trends, an investor can refine timing within each quarter.
Historical Data and Analytical Perspectives
Analyzing past decades reveals that certain months recurrently delivered stronger performance relative to others. Statistical backtesting across multiple gold spot price series confirms these observations.
Long-Term Averages and Monthly Returns
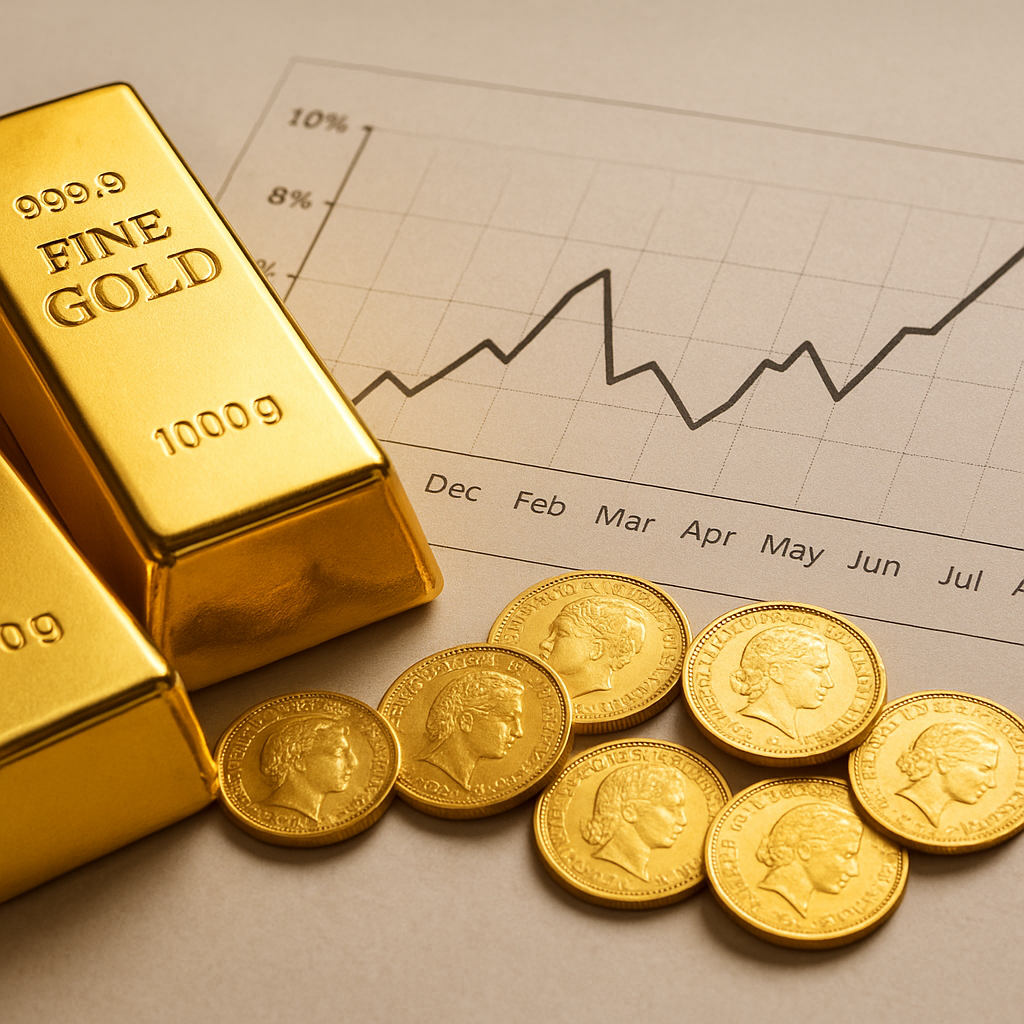
- April to June: Historically, this interval produced mixed outcomes, with peaks around mid-May. Analysis of data from 1970 to 2020 shows a 60% probability of positive returns, averaging near 1.2% monthly gain.
- July to September: Often a period of consolidation, average monthly returns hovered around 0.3%, with increased volatility in years of geopolitical turmoil.
- October and November: The most consistent profit months, showing positive returns over 70% of the time, with an average upward movement close to 1.5% per month.
- December: Performance varies significantly, depending on year-end inflation expectations and fiscal policy announcements. Average change can range from -0.5% to +2%, making it a high-risk, high-reward period.
When combined with moving average crossovers or momentum indicators, these seasonal probabilities can inform more precise entry strategies. A trader might, for instance, wait for confirmatory signals in late September before initiating new purchases ahead of the autumn upswing.
Case Studies of Notable Market Cycles
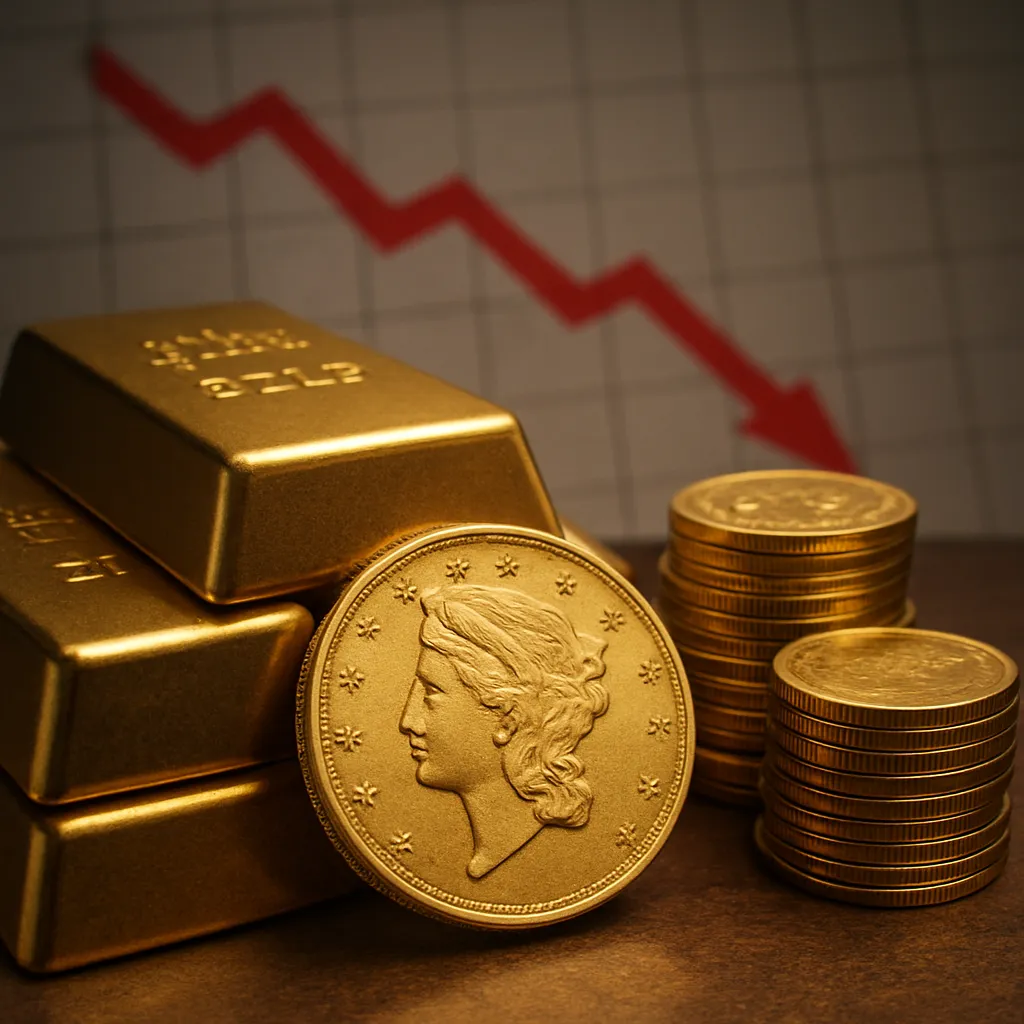
During the high-inflation era of the late 1970s, record prices were reached in January 1980. The buildup began the previous autumn, underscored by rising energy costs and eroding currency confidence. Similar patterns played out in 2008–2009, when the global financial crisis triggered a flight to safety in Q4, propelling gold to fresh highs by March 2009.
More recently, the 2020 pandemic prompted sharp price swings. An initial dip in March was followed by robust buying from mid-April onward, peaking in August. In that cycle, price action mirrored other crisis-driven surges but was magnified by zero-interest-rate policies and unprecedented fiscal stimulus.
External Factors Impacting Gold Valuation
Seasonal and historical trends intersect with broader economic and geopolitical circumstances. Disruptions can shift or amplify typical patterns, making a rigid calendar-based approach insufficient without context.
Central Bank Policies and Interest Rates
Lower real yields on government bonds usually bolster the appeal of non-yielding assets like bullion. Conversely, tighter monetary policy can exert downward pressure. Anticipation of rate changes often triggers pre-emptive moves in the metal markets.
Geopolitical Crises and Safe-Haven Appeal
Events such as regional conflicts or trade disputes elevate demand for gold as a haven. These surges may occur outside standard seasonal windows, overriding typical supply-demand cycles. Traders track news flows and volatility indicators to capture these unplanned opportunities.
Currency Movements and Exchange Rates
Since gold is predominantly priced in US dollars, shifts in the greenback’s strength influence global purchasing power. A softer dollar generally supports higher metal prices, especially during cyclical periods of increased buying interest.
Industrial and Technological Demand
Beyond jewelry and bar markets, industrial uses—ranging from electronics to medical devices—contribute to long-term price foundations. Innovations in green energy and electronics may gradually reshape demand patterns, subtly shifting seasonal peaks over decades.
Practical Strategies for Timing Purchases
By combining historical insights with real-time market signals, investors can develop a systematic plan for acquiring gold at favorable moments. Below are several actionable approaches.
- Dollar-Cost Averaging (DCA): Spreading purchases evenly through each quarter reduces the risk of mistimed lump-sum buys. This method aligns well with seasonal lull periods, smoothing entry points.
- Seasonal Window Shopping: Target Q4 dips or April–May troughs by setting limit orders at predefined levels based on past average lows. This tactic takes advantage of cyclical softness.
- Indicator-Driven Entries: Combine moving averages, relative strength indices, or MACD signals with seasonal probabilities. Enter long positions when technical momentum aligns with historically favorable months.
- Event-Triggered Buys: Prepare to increase allocations during anticipated geopolitical or policy events. Maintain readiness with predefined rules, such as purchasing when the VIX crosses a threshold or when real yields turn negative.
- Hedging and Diversification: Use gold as a hedge within a broader portfolio. During identified seasonal risk zones, you might adjust weights between equities, bonds, and bullion to optimize overall risk/return.
Optimizing timing requires discipline: avoid emotional trades during short-lived price jumps, and stick to a plan informed by both seasonality and market conditions. Maintaining a clear acquisition framework can reduce the psychological burden of speculation.
Integrating Seasonal Wisdom into Long-Term Allocations
While pinpointing the absolute cheapest day of the year to buy gold may prove elusive, embracing a seasonal mindset enhances decision quality. Investors should stay attuned to quarterly demand cycles, overlaying them with macroeconomic indicators. In doing so, they can systematically capitalize on lower-price environments and minimize the impact of market volatility.
Ultimately, persistent and research-backed approaches—anchored in historical patterns and bolstered by technical and fundamental insights—are most likely to deliver consistent outcomes. Recognizing the interplay of seasonality, policy shifts, and geopolitical catalysts paves the way for well-timed, informed investment in one of the world’s oldest stores of value.