Investors seeking to navigate the complex landscape of the global precious metals market often turn to gold as a strategic hedge and store of value. Over decades, the world gold price has exhibited recurring patterns of extended upward and downward moves. Recognizing these long-term bull and bear trends can empower portfolio managers, traders, and individual investors to make more informed decisions, optimize timing, and manage risk more effectively.
Understanding Gold Market Dynamics
The price of gold is influenced by a blend of economic, monetary, and geopolitical factors. Unlike currencies, which are backed by central banks, gold carries intrinsic appeal as a finite resource. Its value often rises during periods of heightened volatility or negative real interest rates. Over multi-year horizons, these broader forces shape persistent trends rather than random short-lived spikes.
Monetary Policy and Inflation
- Expansionary measures by central banks tend to weaken fiat currencies, boosting demand for gold as a hedge against inflation.
- Tightening cycles reduce liquidity, pushing bond yields higher and increasing the opportunity cost of holding non-yielding gold, which may trigger long-term bearish phases.
Global Demand and Supply Dynamics
- Physical demand from jewelry markets, industrial applications, and growing interest in Asia can underpin extended rallies.
- Mining output, discoveries of new deposits, and recycling rates affect supply, contributing to structural changes in gold availability.
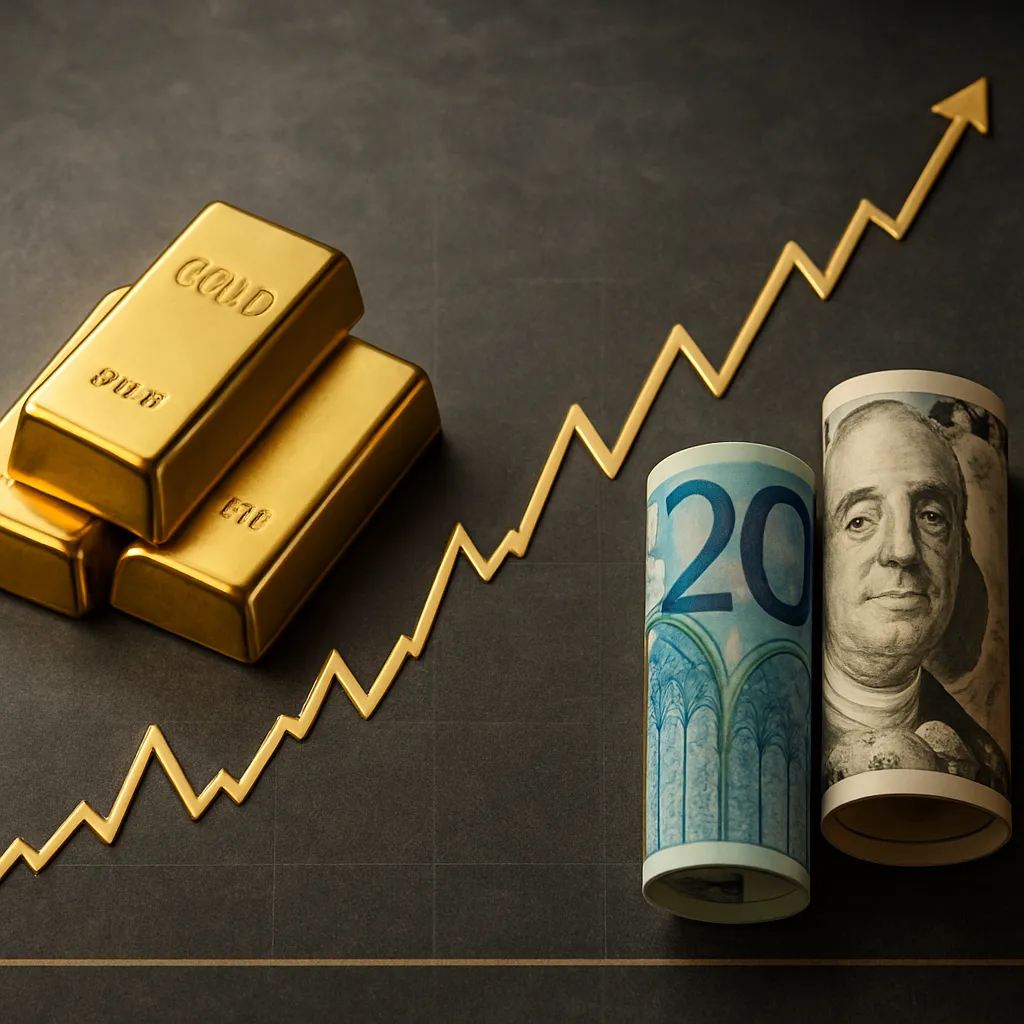
Indicators for Long-Term Bull Trends
Detecting the onset of a sustained bull market requires a blend of technical analysis, fundamental evaluation, and sentiment gauges. The following indicators offer a foundation for spotting robust upward momentum:
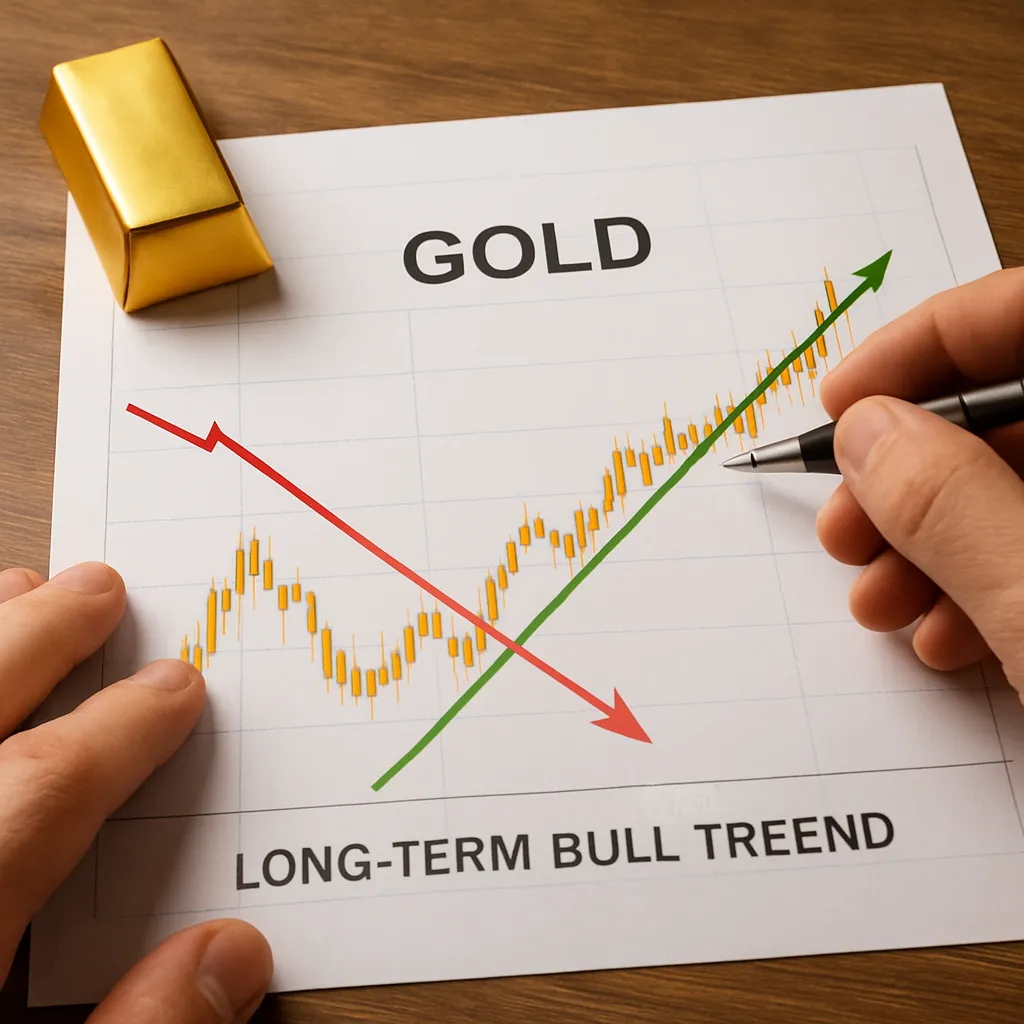
Trendlines and Moving Averages
Long-term trendlines drawn on monthly or quarterly charts help confirm directional bias. When the price consistently respects an upward-sloping trendline, it signals underlying strength. Similarly, the crossover of the 50-month moving average above the 200-month moving average—often referred to as a “golden cross”—can herald such bullish cycles.
Commitment of Traders (COT) Reports
Regular analysis of COT data reveals positioning shifts by large speculators and commercial hedgers. A rising net long position by non-commercial traders typically aligns with the early stages of a multi-year advance.
Macroeconomic Triggers
- Elevated government debt and persistent budget deficits add fuel to gold’s allure as a non-sovereign asset.
- Episodes of currency devaluation or banking crises prompt capital to flow into gold, driving sustained price appreciation.
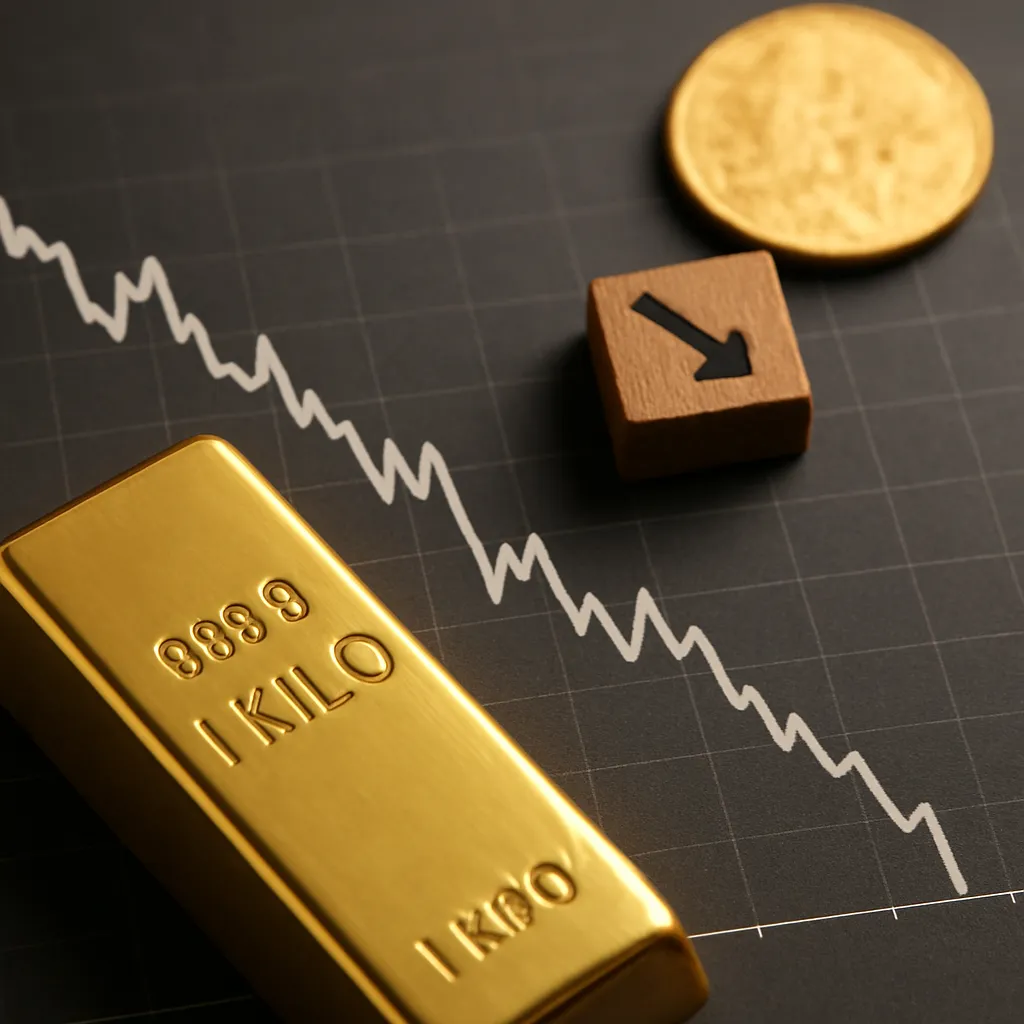
Recognizing Long-Term Bear Trends
Bear markets in gold can stretch for years, eroding the price from peak levels to lower support zones. Identifying these downturns early enables investors to adjust exposures or implement protective strategies like options hedges or rotational trades.
Breaks in Key Support Levels
When prices fall below major horizontal support established over several years, it underscores a shift in market psychology. A decisive breach of the previous cycle high-turned-support often confirms a prolonged bearish phase.
Rising Real Yields
During inflationary surges, central banks may raise interest rates aggressively. This hike increases real yields on government bonds, making gold less attractive over the long haul. Monitoring Treasury inflation-protected securities (TIPS) yields can reveal this negative correlation with gold.
Reduced Central Bank Buying
Central banks are among the largest official purchasers of physical gold. A noticeable decline in their net acquisitions can reflect diminishing institutional demand and signal weakening fundamentals for future price support.
Case Studies and Historical Patterns
A look at past decades provides valuable lessons on how gold cycles evolve. By examining these historical episodes, one can extract common themes and apply them to contemporary market conditions.
The 1970s Supercycle
- Fuelled by high inflation, currency devaluations, and geopolitical strife, gold soared from under $40 per ounce in 1971 to over $800 by 1980.
- Key technical breakout above the 1974 highs validated a powerful multi-year rally.
The 1980s–1990s Bear Market
- Rising real interest rates under monetarist policies pressured the gold price downward for nearly two decades.
- Structural shifts towards equities and bonds, along with improved inflation control, reduced gold’s appeal.
The 2000s Bull Resurgence
- Global financial imbalances, central bank rate cuts, and quantitative easing spurred gold from around $250 in 2001 to a peak above $1,900 in 2011.
- Massive fiscal stimulus following the 2008 crisis acted as a catalyst for gold’s prolonged uptrend.
Implementing a Trend-Based Strategy
Building a strategy around long-term gold cycles involves several practical steps. Investors should calibrate position sizing, entry timing, and risk controls according to broader market context rather than short-term noise.
- Use trend confirmation tools such as moving average crossovers and trendline retests to minimize whipsaw risk.
- Employ staggered entries or cost averaging to manage volatility and avoid mistimed allocations.
- Incorporate non-correlated assets—like certain equities or real estate—to balance periods of gold underperformance.
- Stay informed on central bank policies, macroeconomic data releases, and shifts in global liquidity flows that affect gold.
Conclusion of Insights
By blending technical frameworks with fundamental research and sentiment analysis, market participants can identify enduring bull and bear trends in the world’s most traded precious metal. A disciplined approach to trend recognition, backed by vigilant monitoring of macro drivers and historical precedents, fosters greater resilience in portfolios exposed to gold’s long-term fluctuations.