Understanding the interplay between various assets in global markets is essential for investors seeking to optimize their strategies. Gold has long held a unique position as both a store of value and a hedge against economic uncertainty. By examining the relationships between gold and other commodities, financial professionals can uncover patterns of correlation, identify opportunities for diversification, and manage risk effectively.
Why Gold Matters in Global Markets
Gold’s reputation extends far beyond its lustrous appearance. As a precious metal with millennia of history, it plays several critical roles today:
- Safe haven asset during periods of economic turmoil
- Inflation hedge when fiat currencies depreciate
- Portfolio anchor, providing stability amid market swings
- Liquidity provider in times of crisis
Its dual function as both a commodity and a monetary asset gives gold a distinctive status. Investors often turn to gold when equity markets become turbulent, or when real interest rates turn negative. In these scenarios, understanding how gold moves relative to energy, industrial metals, and agricultural products is crucial for a well-rounded portfolio strategy.
Key Metrics for Measuring Correlation
Analyzing the relationship between gold and other commodities requires a combination of quantitative tools and qualitative insights. Below are several commonly used metrics:
- Pearson Correlation Coefficient: Measures linear correlation, ranging from -1 to +1.
- Rolling Correlations: Tracks how correlation changes over a specified time window (e.g., 30, 60, or 90 days).
- Spearman’s Rank Correlation: Captures monotonic relationships even if they aren’t linear.
- Cointegration Tests: Identifies long-term equilibrium relationships between gold and another commodity.
- Principal Component Analysis (PCA): Distills multiple commodity price series into core driving factors.
Each metric has its own strengths. For instance, Pearson correlation is simple to compute and interpret but may miss nonlinear dynamics. Cointegration tests, on the other hand, reveal whether two price series move together over time, suggesting arbitrage opportunities if a divergence occurs.
Volatility Dynamics and Their Impact
Volatility plays a pivotal role in how assets correlate. Two commodities might exhibit low correlation during calm periods but become highly correlated during market stress. The following factors influence these dynamics:
- Market Liquidity: Thin trading can amplify price swings and distort correlations.
- Macroeconomic Shocks: Events like central bank announcements or geopolitical crises can trigger synchronous moves.
- Supply Chain Disruptions: Natural disasters or trade restrictions may affect several commodities simultaneously.
- Investor Sentiment: Herd behavior can lead to “flight to quality,” pushing investors into gold alongside certain safe-haven currencies.
In quantitative terms, volatility clustering can be captured by GARCH-type models, which help forecast time-varying risk and correlation. By overlaying these forecasts with real-time price data, analysts can anticipate shifts in asset behavior.
Practical Steps for Conducting a Correlation Analysis
Below is a concise workflow for professionals aiming to dissect the interplay between gold and a selected commodity:
- Data Gathering:
- Obtain historical daily or weekly price series from reputable sources.
- Adjust for rollovers in futures contracts to maintain consistency.
- Clean the dataset by removing outliers or erroneous entries.
- Preliminary Analysis:
- Plot time series to visualize trends and seasonal patterns.
- Compute basic statistics: mean, standard deviation, skewness, and kurtosis.
- Correlation Computation:
- Calculate Pearson and Spearman coefficients over the full sample.
- Implement rolling-window correlations to detect regime shifts.
- Advanced Testing:
- Perform cointegration tests (e.g., Engle-Granger, Johansen) to check for long-run relationships.
- Use PCA or factor models to understand common drivers among multiple commodities.
- Interpretation and Strategy:
- Assess whether observed correlations align with economic fundamentals.
- Design hedging strategies if a strong long-term relationship exists.
- Rebalance the diversification mix to minimize drawdowns during periods of high volatility.
Case Study: Gold vs. Crude Oil
A popular pair for analysis is gold and crude oil, given their roles in energy markets and inflation expectations. Key observations often include:
- Inflation Link: Rising oil prices can fuel inflation, prompting central banks to adjust policy rates, which subsequently influences gold yields.
- Supply Shock Correlations: Geopolitical tensions in oil-producing regions may push both oil and gold prices higher as investors seek safe havens.
- Divergence Signals: Periods where oil surges but gold lags might indicate upcoming shifts in global growth projections.
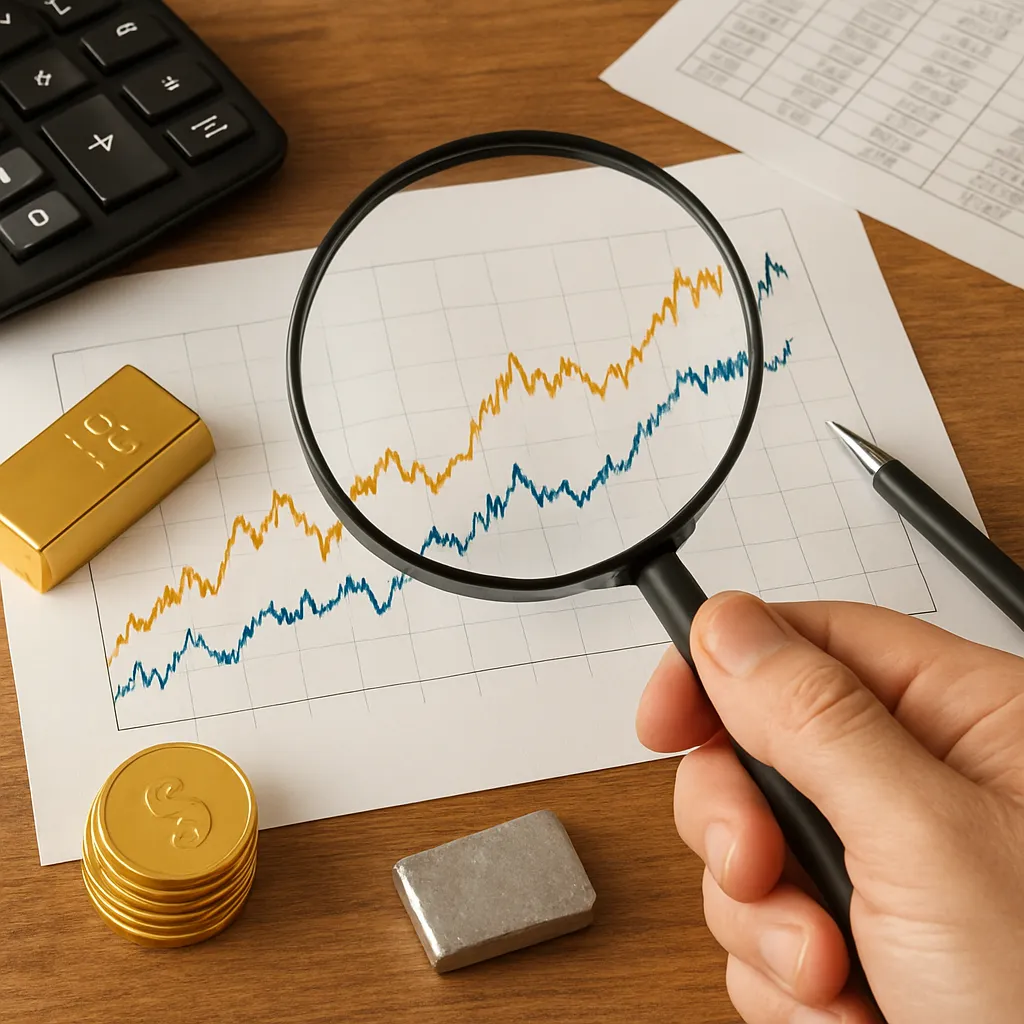
Graphical analysis typically involves plotting normalized price indices and examining co-movements during selected windows, such as pre- and post-2008 financial crisis.
Advanced Analytical Techniques
For deeper insights, consider supplementing traditional methods with modern tools:
- Machine Learning Models: Algorithms like Random Forests or LSTM neural networks can uncover nonlinear patterns and predictive signals between gold and other commodities.
- Sentiment Analysis: Scraping news headlines, social media, and central bank reports to gauge market mood and its influence on price correlations.
- Network Analysis: Constructing correlation networks to visualize complex interdependencies among a wide basket of commodities.
- Regime-Switching Models: Identifying different market states (e.g., bullish, bearish) and measuring how correlations evolve across regimes.
Integrating these advanced approaches can uncover subtle patterns that traditional econometric models may overlook, strengthening both short-term trading tactics and long-term asset allocation decisions.